- SHIB has formed a bullish pattern, suggesting that the asset could be gearing up for a rally.
- However, technical indicators tell a different story, showing a lack of alignment with this upward trajectory.
Over the past week and month, Shiba Inu [SHIB] has posted steady gains despite market volatility. In the last 24 hours alone, it added 2.67%, reflecting the current trends across the broader market.
Despite the recent uptick, uncertainty still clouds the asset’s future direction. Will SHIB push higher or consolidate within its bullish pattern over a longer period?
AMBCrypto’s analysis explores the potential outcomes.
SHIB gearing up for a major move
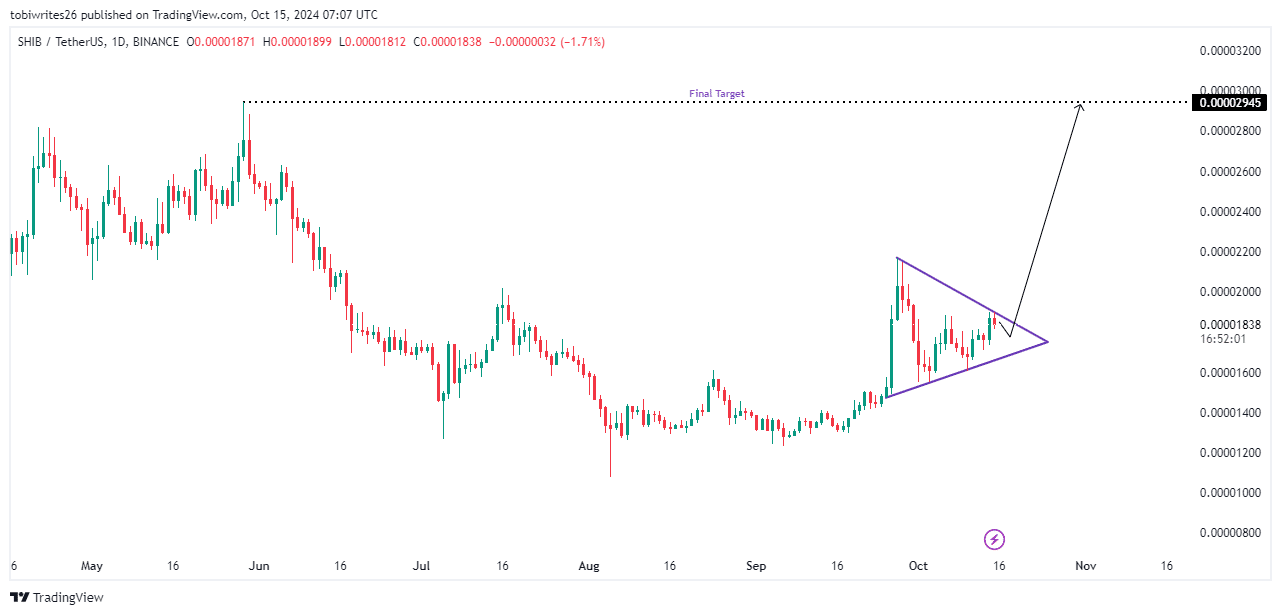
Shiba Inu was consolidating within a symmetrical triangle pattern, a technical formation where prices oscillate between narrowing resistance and support levels. This signals a potential build-up for a significant price move.
Traders appear to be accumulating SHIB, betting on a breakout that could trigger a rally. The rationale is simple: higher holdings now could translate into greater profitability if the price takes off.
A breakout from this consolidation could push SHIB toward $0.00002954—a level where strong selling pressure might emerge and potentially cap further gains.

Source: TradingView
However, while the accumulation phase is underway, technical indicators suggest the anticipated breakout could be delayed. More details are provided in the analysis below.
SHIB’s rally may be delayed
Technical indicators suggest that Shiba Inu (SHIB) will likely experience a delayed rally, with no imminent breakout. This implies that SHIB may continue trading within its accumulation phase for several more sessions.
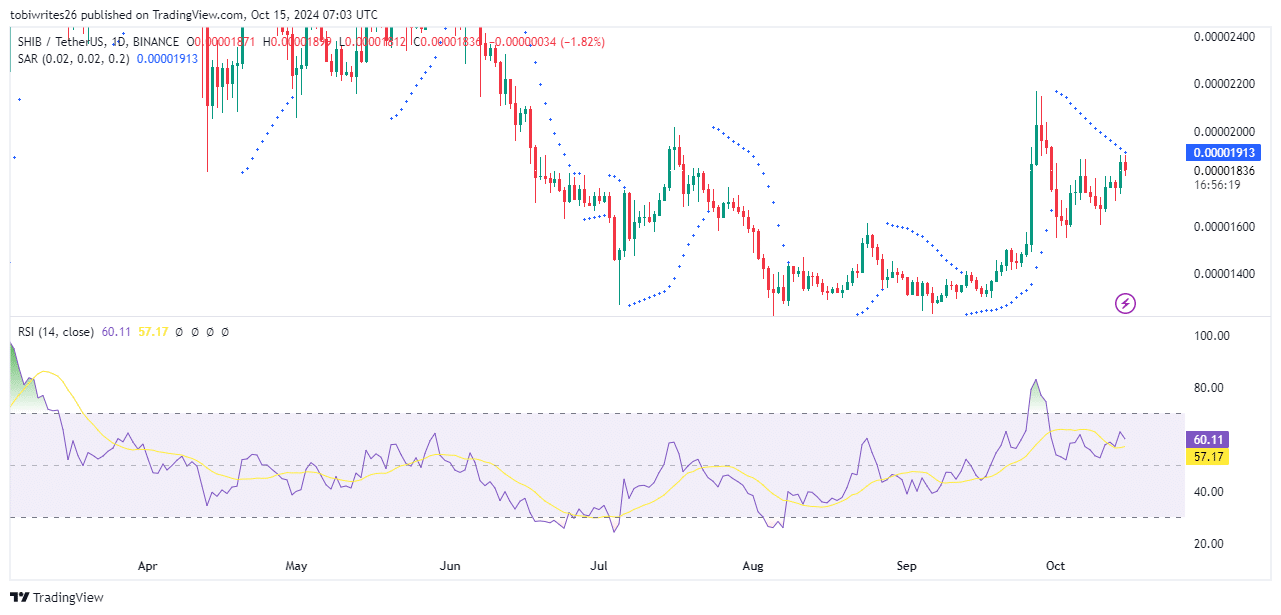
One indicator is the Parabolic SAR, which has formed dots above SHIB’s price—indicating potential downward pressure that could push the asset’s price lower.
The Relative Strength Index (RSI), which measures the speed of price changes and gauges market sentiment, shows similar bearish signals.
As of this writing, the RSI has shown a downtick, with the price following suit. If this downward momentum persists, SHIB could see a further decline.


Source: Trading View
The expected target for this move is the support level within the symmetrical triangle pattern, where the price may seek renewed buying interest before any significant upward trend resumes.
Despite the current bearish indicators, AMBCrypto notes that underlying bullish sentiment remains in the market. This suggests that while SHIB could face a minor decline, a breakout from the pattern may still be on the horizon.
SHIB is set for an upward move
Shiba Inu (SHIB) appears ready for a breakout, as trading activity shows strong bullish signs.
According to Coinglass, SHIB’s Open Interest has increased by 15.60%, reaching $53.58 million.
This rise indicates a surge in long positions being opened or added, suggesting traders are anticipating a price increase.


Source: Coinglass
Read Shiba Inu’s [SHIB] Price Prediction 2024–2025
Further supporting this bullish outlook is the increase in short liquidations. Over the past 24 hours, short traders betting on a significant drop in SHIB lost $349.72 thousand as the asset held its ground.
With Open Interest climbing and short liquidations outpacing long liquidations, SHIB is edging closer to breaking out of its current accumulation phase, signaling potential upward momentum shortly.

