- The weekly time frame for Binance showed a key level to close above for a rally.
- The liquidation heatmap and profitability on BUSD signaled bullish momentum.
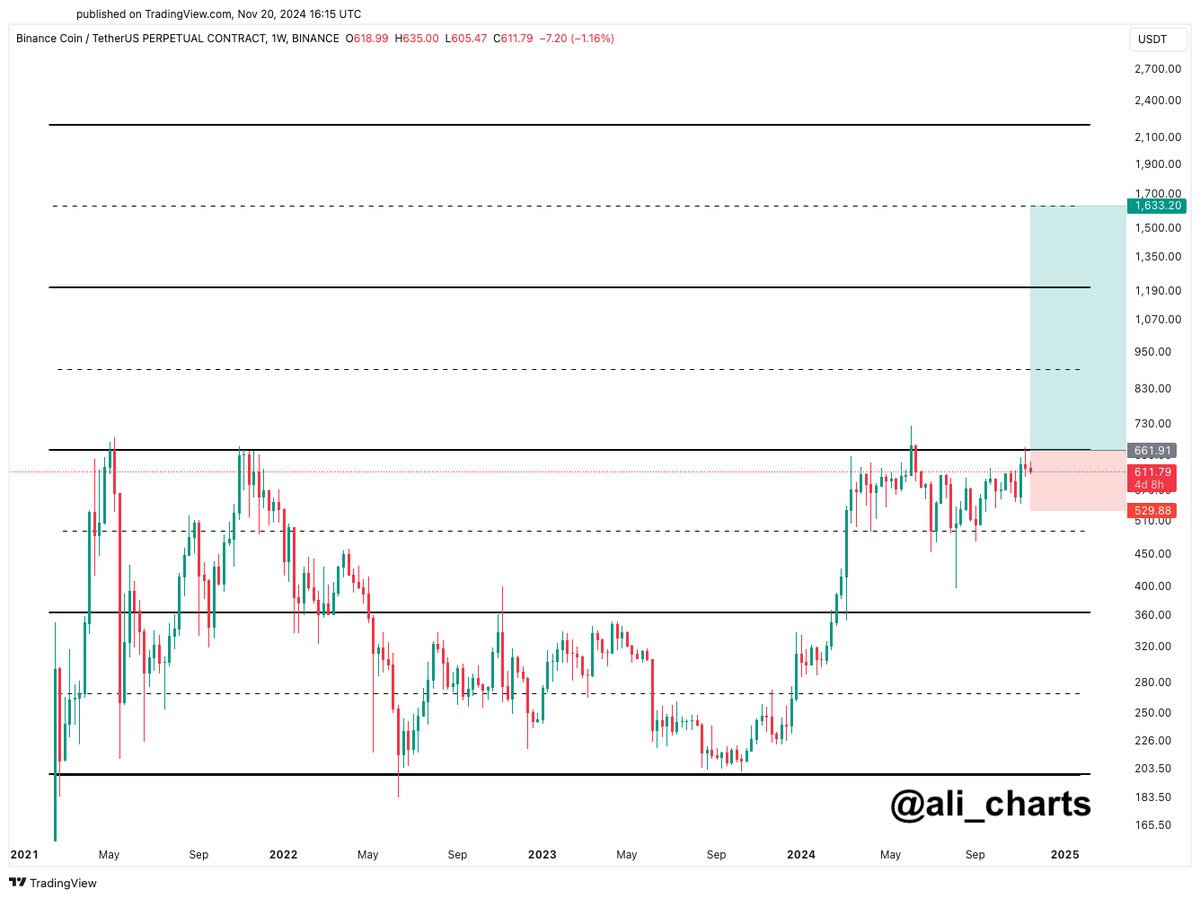
The weekly chart for Binance Coin [BNB] exhibited strong bullish momentum as it approached a critical resistance level.
BNB soared past multiple resistance levels and, settling in near the $662 mark at press time.
Analysts noted that a close above this level could open the way for a rally towards $1630, a target set by psychological expectations.
This potential move was indicated by the consistent higher lows BNB has been marking since early 2024, demonstrating a robust uptrend.
The recent volume spike further validated the strong buying interest at current price levels, suggesting a firm support base around $529.88.
Source: Ali/X
This support, coupled with the ascending trend, positioned BNB well for a continued uptrend. A secure weekly close above $662 could confirm the bullish scenario, potentially ushering an historic price rally.
The implications of such a move are substantial, marking a pivotal phase for Binance Coin in the competitive crypto market.
BNB’s RSI and MACD flipping bullish
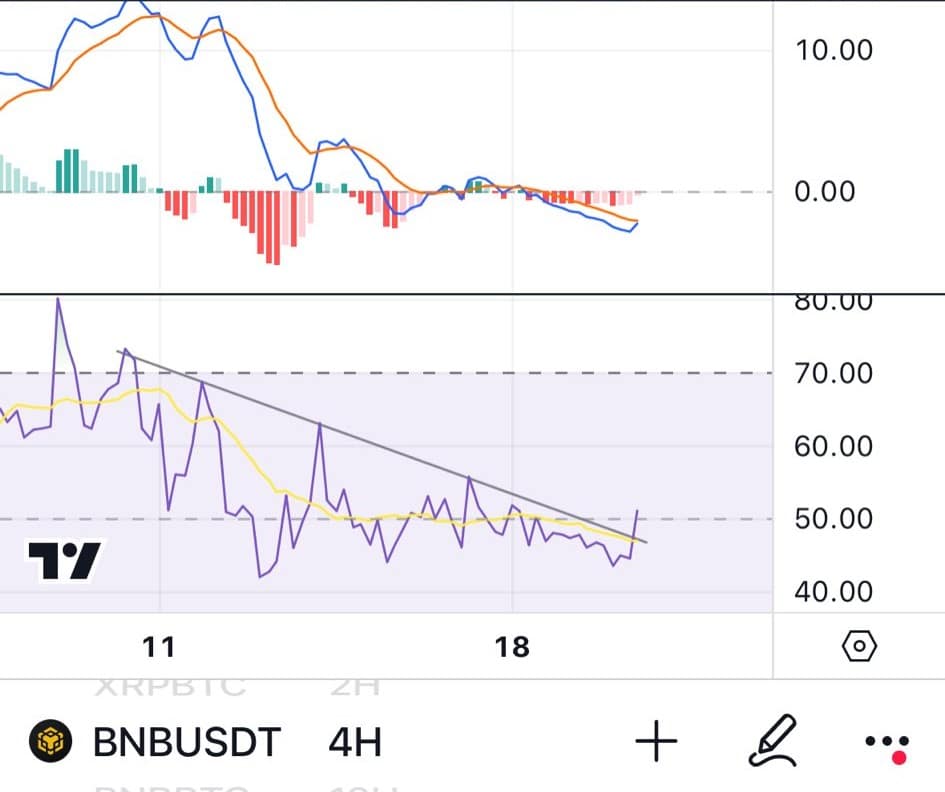
The BNB on the 4-hour showed a positive shift as the Relative Strength Index (RSI) broke above its descending trendline, indicating renewed bullish momentum.
Alongside the RSI, the Moving Average Convergence Divergence (MACD) has also turned bullish, highlighting an increase in buying pressure.

Source: Trading View
This technical turnaround suggests that if BNB can maintain a weekly close above the pivotal $662 level, the asset might aim for a much higher target of $1630.
This potential significant rise underscores a robust recovery and growing confidence among traders in the BNB market’s strength.
Liquidation heatmap and BUSD profitability
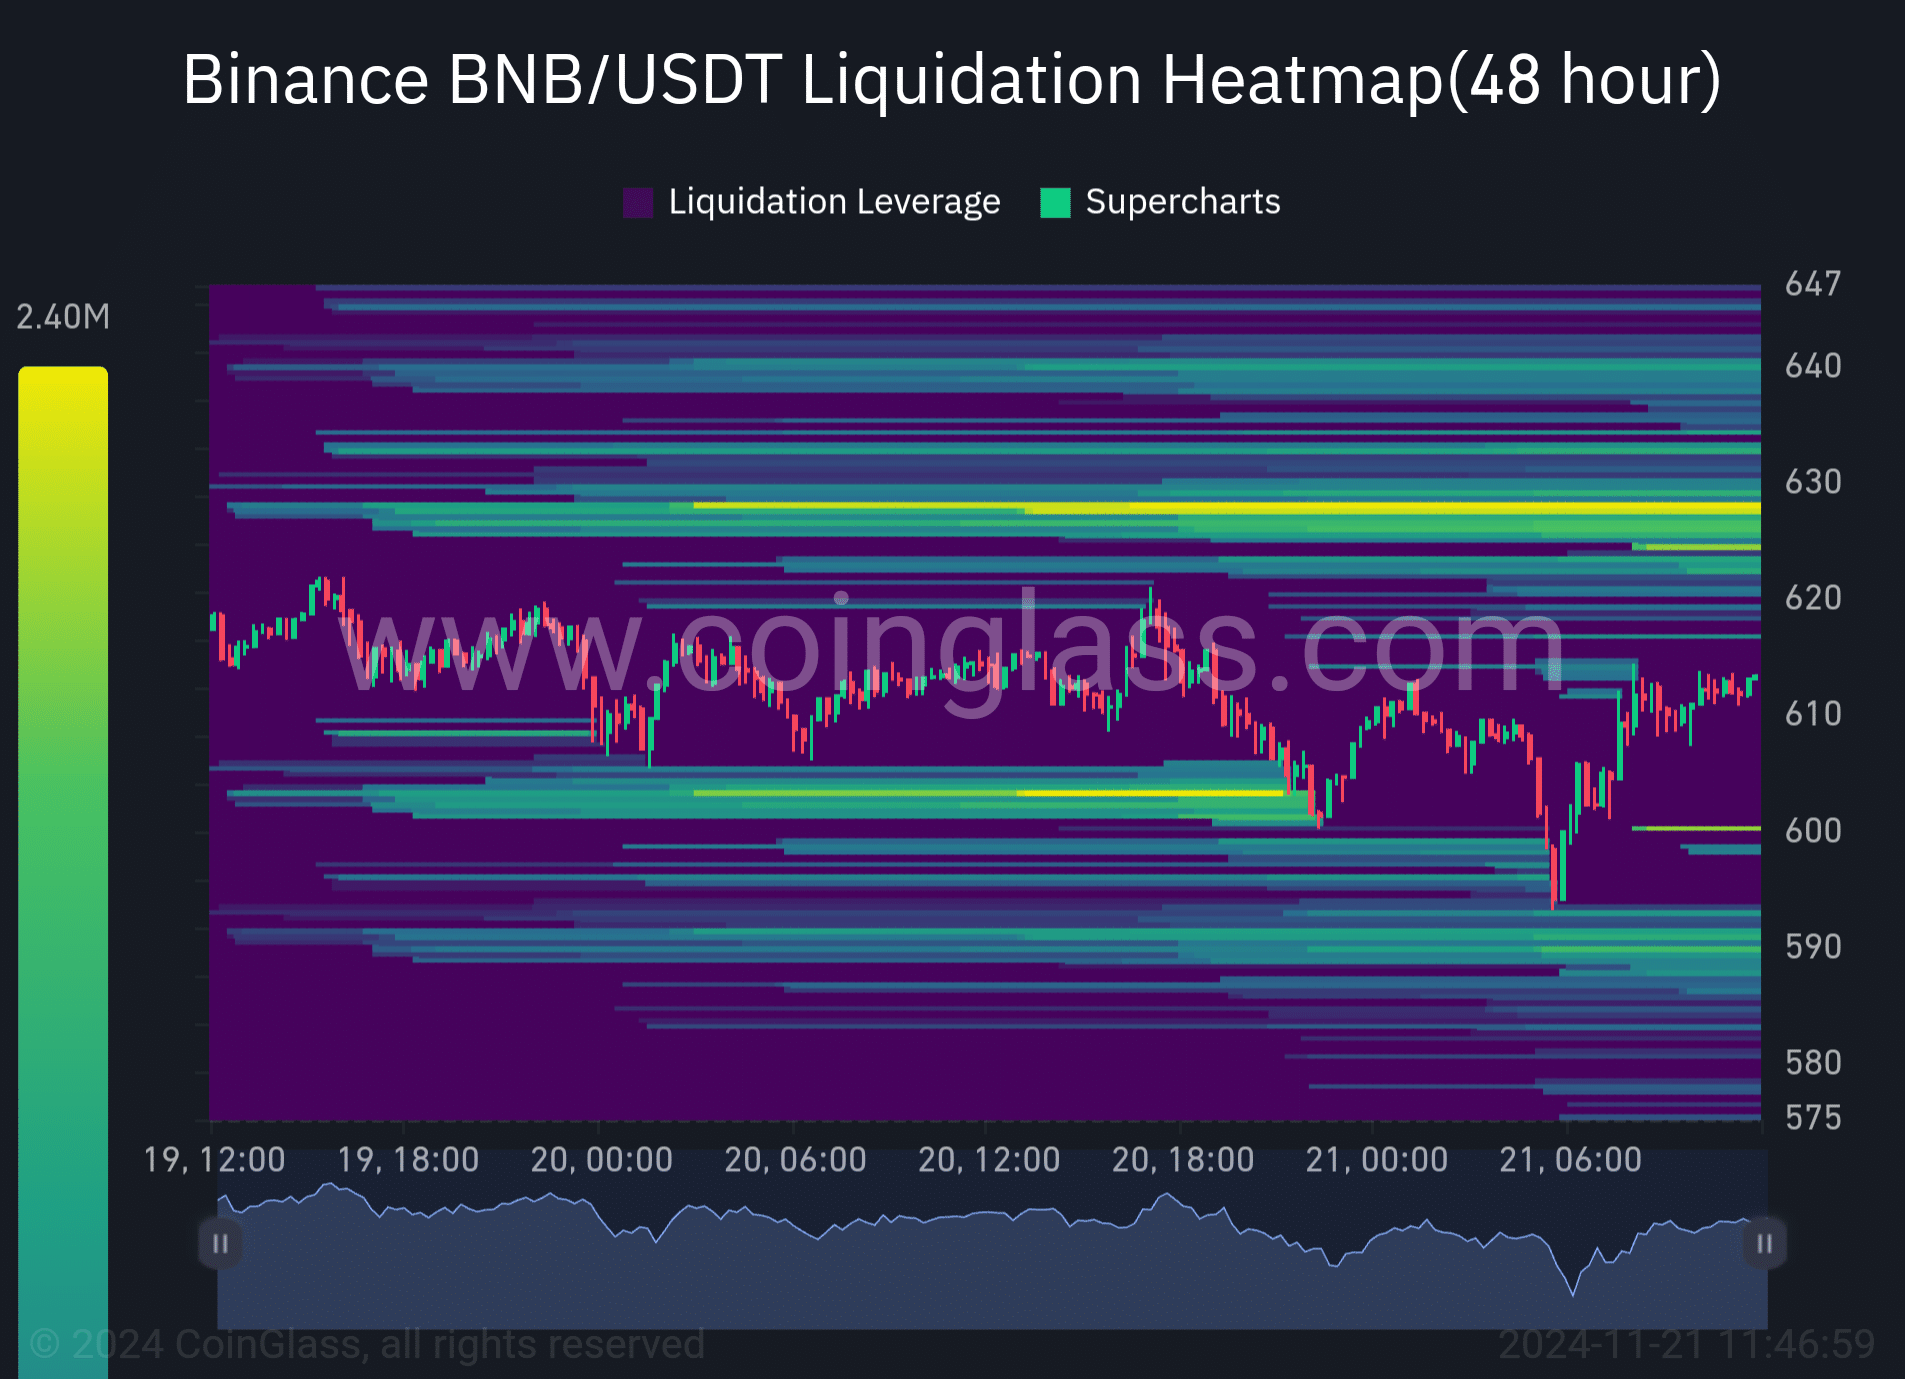
BNB/USDT liquidation heatmap revealed a crucial band between $600 and $647, indicating potential pivot points for market action.
If Binance Coin (BNB) maintains its position above the $662 level this week, the next significant rally might propel it towards a $1630 target.
The heatmap showed considerable liquidation levels at lower prices, suggesting strong support near the $600 mark.

Source: Coinglass
Liquidation levels need to be watched closely, as traders anticipate shifts that could trigger further upward momentum in BNB’s price.
This activity indicated a heightened market interest and potential for BNB’s value to increase if key resistance points are breached.
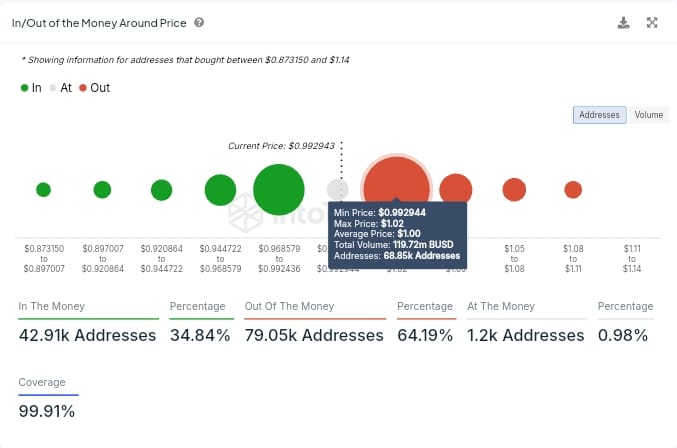
Additionally, on-chain data for Binance USD showed that 42.91K addresses were in the money, representing 34.84% of holders.
The majority of the total, 79.05K addresses, accounting for 64.19% of holders, found themselves out of the money.

Source: IntoTheBlock
Read Binance Coin’s [BNB] Price Prediction 2024–2025
The majority of BUSD purchased occurred in the price range of $1.00 to $1.02, totaling 68.85K addresses.
These figures indicated a possible pivot if BNB closes above the $662 mark this week, potentially setting a trajectory towards the $1630 level on the weekly timeframe.

