
- TRX & ADA are in a fierce battle for market dominance
- A flip could be underway soon if a few key metrics turn around
Tron [TRX], Cardano [ADA], and Dogecoin [DOGE] are vying for dominance, with TRX and ADA locked in a tight contest for the 9th spot in market capitalization rankings. However, Cardano’s prolonged consolidation below $1 has raised concerns about its ability to maintain investor confidence.
In fact, on-chain data revealed structural weakness in ADA’s network activity – Daily active addresses have contracted 30.3% year-over-year, while fee generation has slipped below pre-election levels to just $8.1k.
These deteriorating metrics hinted at a diminishing demand profile, potentially driving capital rotation towards TRON as a more resilient “alternative.”
To assess whether this transition is materializing, AMBCrypto analyzed key blockchain data, tracking capital migration, staking trends, and whale positioning.
Is TRX “structurally positioned” to outpace ADA, or have Cardano’s weakening fundamentals given it an edge?
Comparative analysis revealed key insights
On-chain analysis highlighted a stark divergence between Tron and Cardano. While Cardano’s network activity has deteriorated, TRON’s liquidity inflows remain robust, driven by stablecoin dominance.
A fresh $1 billion USDT mint on TRON reinforced its position as a settlement layer, potentially amplifying TRX’s staking demand and network utility.
The contrast is evident in transaction metrics – TRON’s daily transactions surged 76.8% year-on-year to $9.1 million, whereas Cardano’s fell 38.8% to just 28.7k, reflecting sustained structural weakness.
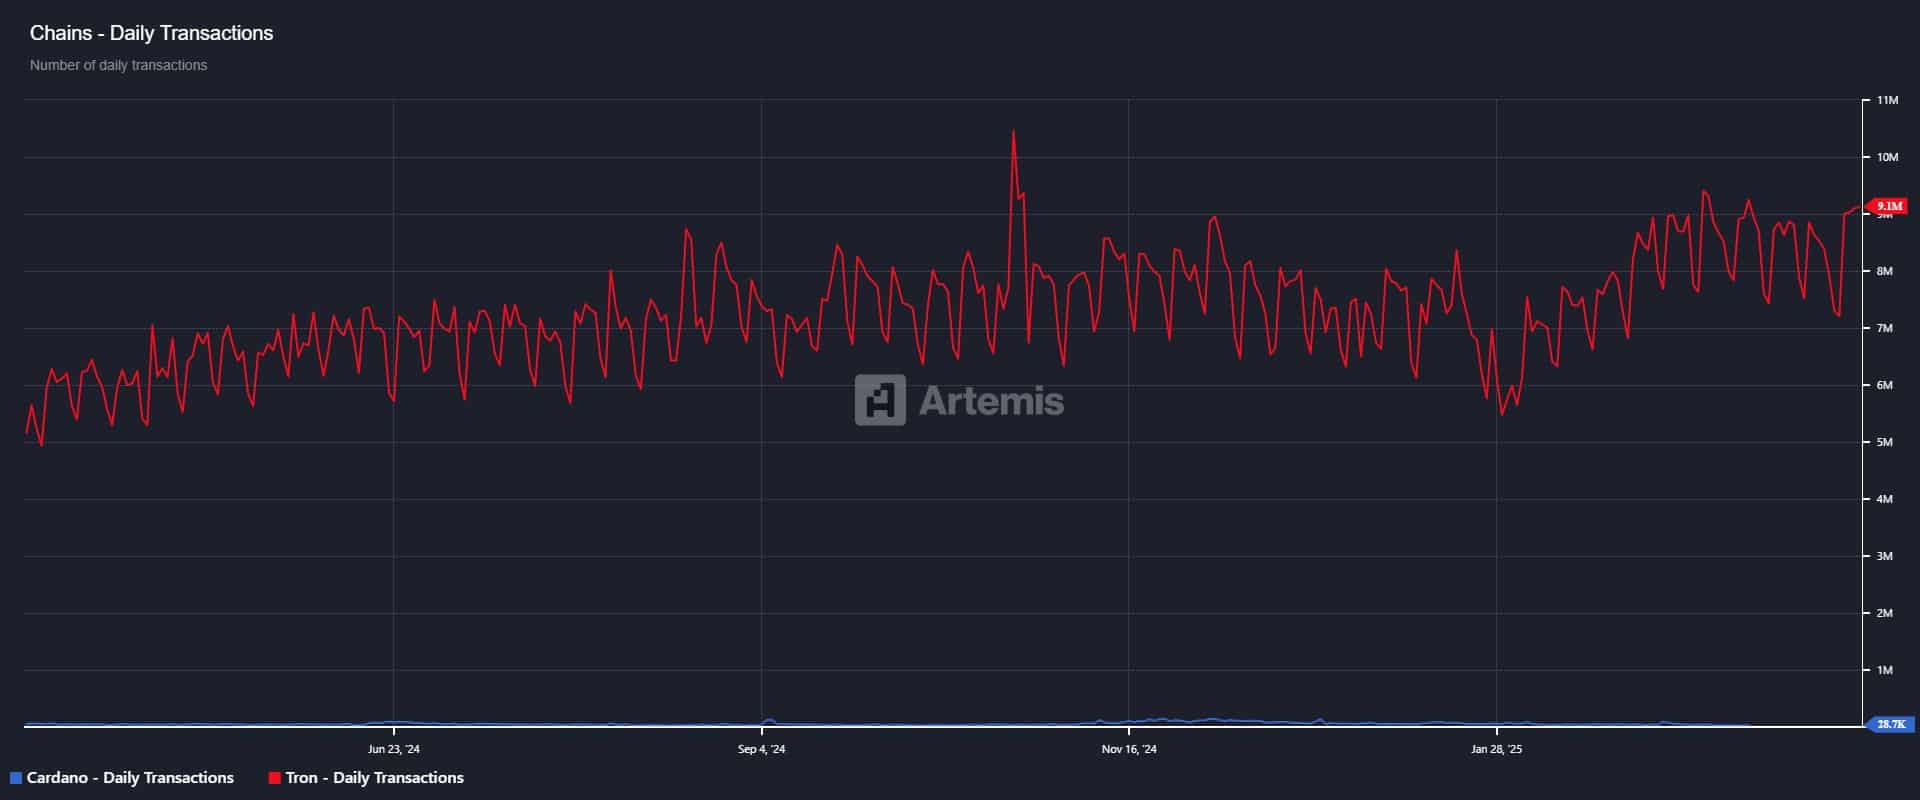
Source: Artemis Terminal
However, TRON’s Total Value Locked (TVL) dipped by 9% to $7.3 billion, signaling that stablecoin dominance hasn’t driven DeFi expansion. Conversely, Cardano’s TVL climbed 17.4% YoY to $431 million – A sign of increasing DeFi adoption.
Despite the DeFi lag, TRX’s trading volume soared 179.4% daily to $955.27 million, with sustained address growth – Indicating persistent market demand for the asset.
This data underscores a critical shift – TRON’s structural advantage over Cardano isn’t merely a function of ADA’s deteriorating fundamentals.
Instead, it’s a direct outcome of TRX’s expanding liquidity base, heightened settlement utility, and robust market positioning.
Price action implications – ADA vs. TRX
The structural divergence between ADA and TRX is increasingly reflected in their price action. ADA closed Q1 with a 21% drawdown, while TRX exhibited relative strength, limiting losses to 8%.
More critically, ADA’s monthly performance highlighted persistent sell-side pressure, recording a steep 15.63% decline. On the contrary, TRX has defied broader macro headwinds, rallying by 7% over the same period.
However, both assets share a similar post-election reversion. ADA remains 52% below its cycle high, while TRX follows closely with a 47% drawdown, indicating that a significant portion of network participants remain in an unrealized loss position.
On-chain trends seemed to reinforce this divide. Cardano’s rising dormant coin activity highlighted potential capitulation risks as ADA breached key support thresholds. Meanwhile, TRX has maintained price stability within its $0.25–$0.20 accumulation range for over four months.

Source: TradingView (ADA/USDT)
Structurally, TRX presents a more favorable breakout setup, reinforcing its claim to the 9th spot in market capitalization rankings.
If this trend persists, TRX could challenge the top 8, with its market cap eyeing a potential expansion beyond $24 billion.