- TRX’s daily active addresses and transactions went up.
- TRX was up by more than 5%, and a few indicators suggested a further price hike.
Tron’s [TRX] performance over the past several months was commendable, as it reached quite a few milestones. The blockchain boosted its high network activity, and it also performed well on the price front, as it was among the few cryptos with a green weekly price chart.
Tron’s network activity soars
IntoTheBlock recently posted a tweet highlighting an interesting development related to the Tron blockchain. As per the tweet, since the beginning of the year, the number of active Tron addresses has steadily increased, approaching a daily average of 2.5 million.
This increase far surpasses the number of top layer-1 blockchains, reflecting the massive adoption and usage of Tron.
Since these numbers looked optimistic, AMBCrypto checked Artemis’ data to delve deeper into TRX’s network activity.
As per our analysis, TRX’s daily active addresses have been growing steadily since the last month. Thanks to that, the blockchain’s daily transactions also followed a similar increasing trend.

Source: Artemis
Apart from this, things in terms of captured value also looked positive. Both TRX’s fees and revenue increased last month.
However, TRX’s performance in the DeFi space dwindled during the last seven days. This was evident from the substantial dip in its TVL.
TRX stays green
Amidst this, TRX became one of the few cryptos on the top 20 list that managed to paint its weekly chart green.
According to CoinMarketCap, TRX’s price increased by more than 5% in the last seven days. At the time of writing, TRX was trading at $0.1231 with a market capitalization of over $10.7 billion, making it the 11th largest crypto.
The better news was that TRX’s long/short ratio increased. Whenever the metric rises, it means that bullish sentiment around a token is dominant in the market.

Source: Coinglass
A few of the technical indicators also looked pretty bullish on the token. For instance, the MACD displayed a clear bullish advantage in the market.
The Chaikin Money Flow (CMF) registered a sharp uptick, hinting at a continued price rise. However, Tron’s price had touched the upper limit of the Bollinger Bands. Whenever the price touches the upper limit of the indicator, it hints at a correction.
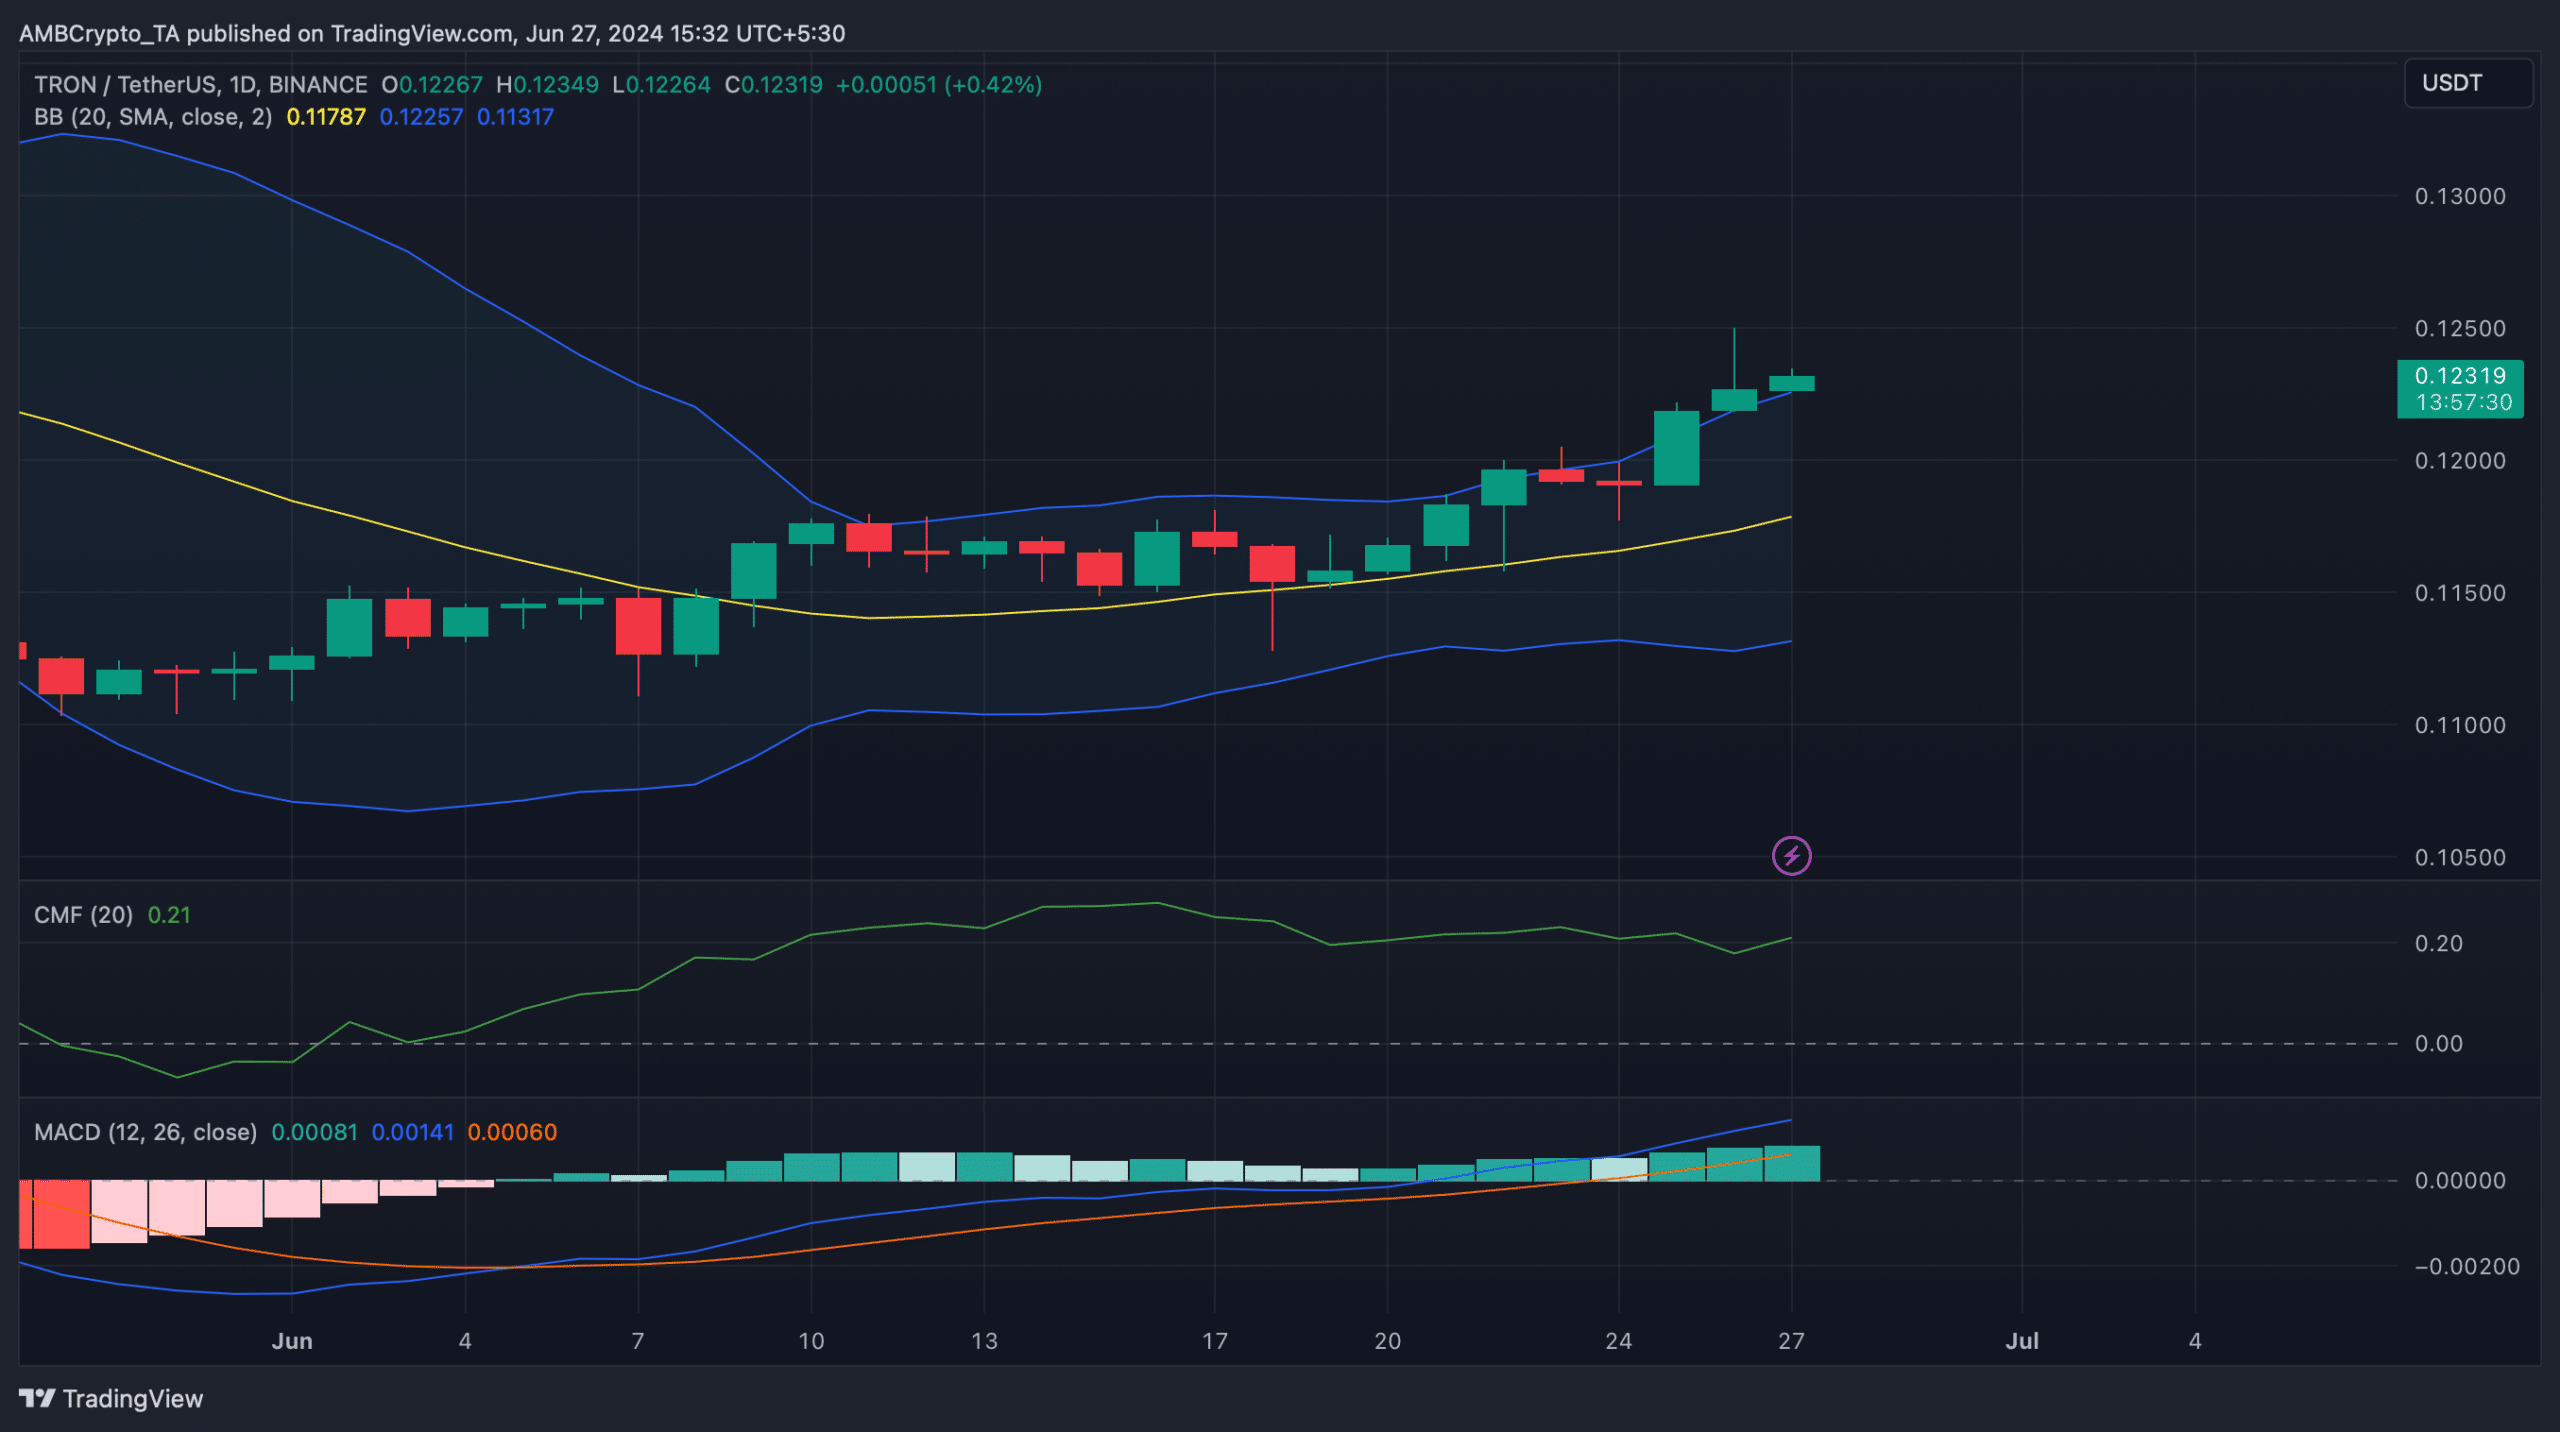
Source: TradingView
Read Tron’s [TRX] Price Prediction 2024-25
If a price correction happens in the coming days, TRX’s price might dip to $0.115 as liquidation would rise sharply at that level.
However, if the bulls continue to control the market, investors might soon witness TRX touch $0.13.

Source: Hyblock Capital