- Hedera was trading within a range and faces a tough challenge at $0.32
- Despite the 20% price bounce from its local lows, the H4 CMF did not signal significant capital inflows
Hedera [HBAR] formed an inverse head and shoulders pattern on the 4-hour timeframe. A bullish breakout and a move to $0.42 can be expected, but this did not materialize. Instead, the $0.32 resistance proved to be a challenge too big for the bulls to overcome.
Range formation challenges- HBAR bulls move beyond the mid-range level
Source: HBAR/USDT on TradingView
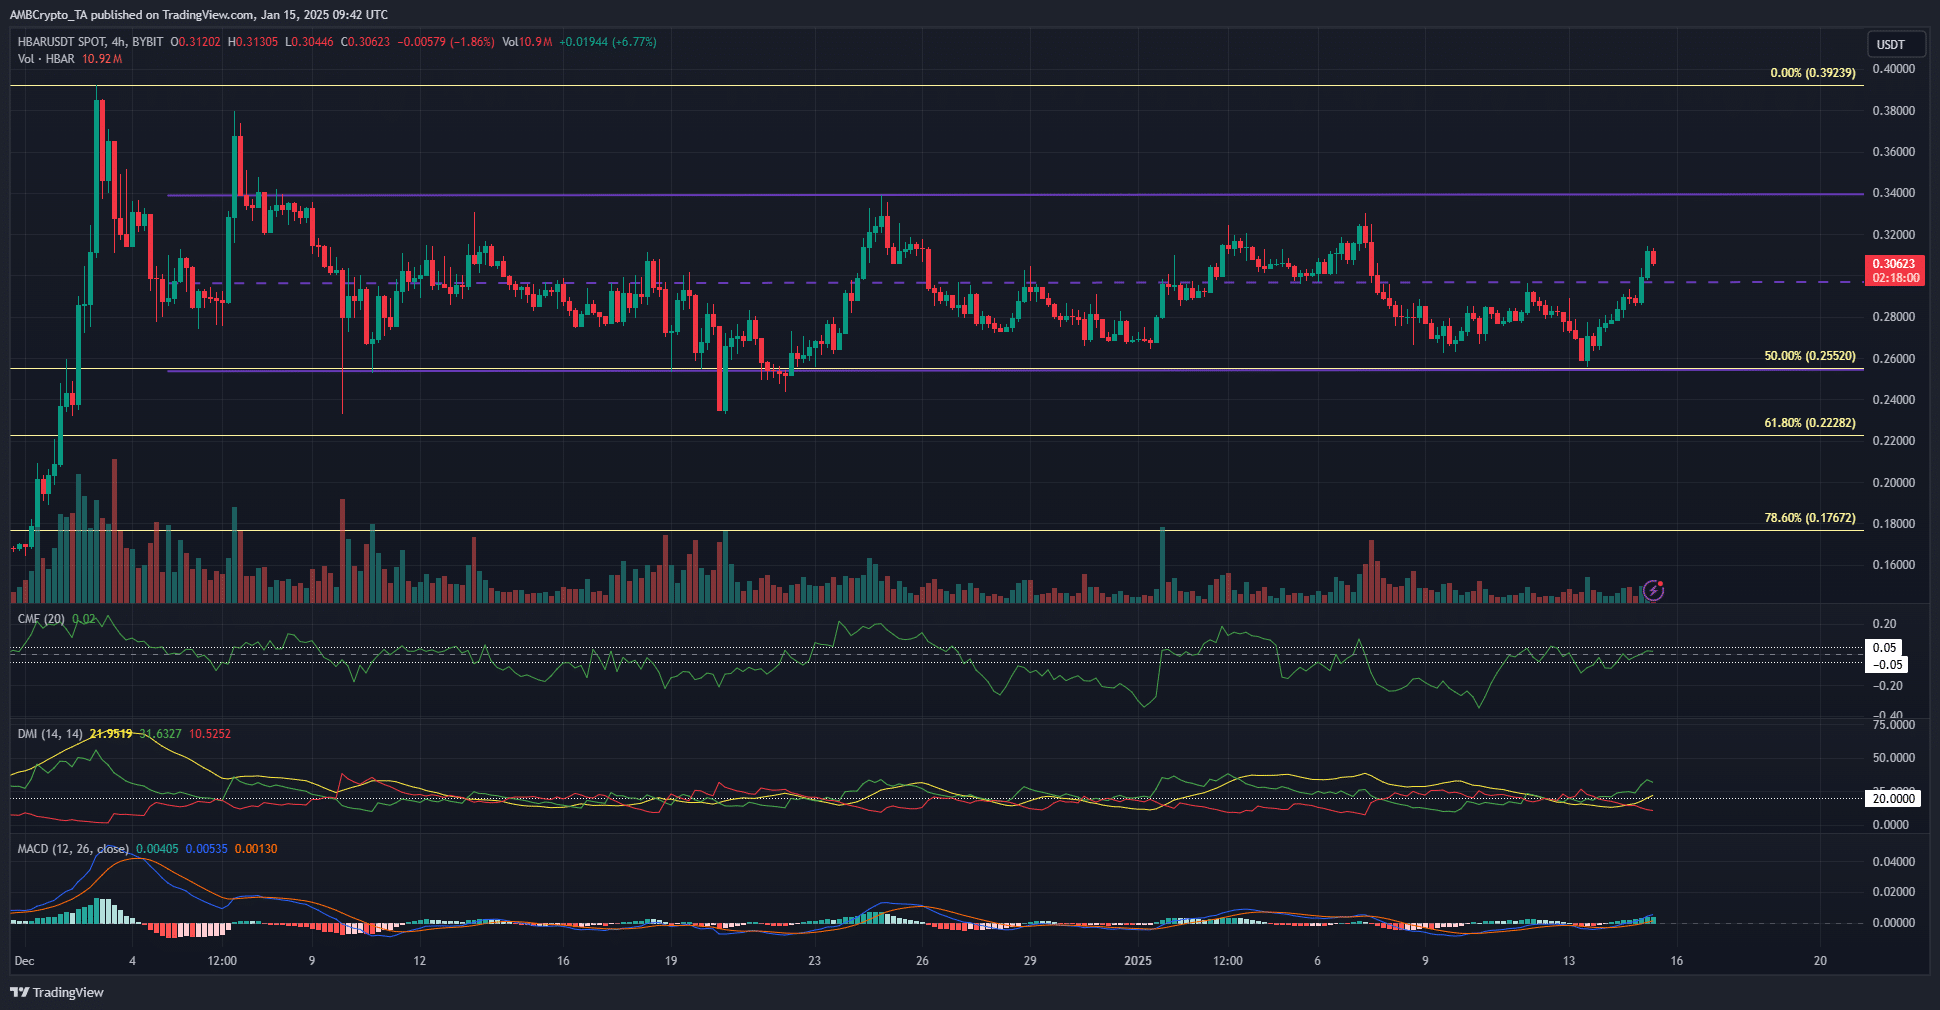
Over the past month, Hedera has been trading within a range. The range extremes lay at $0.255 and $0.339, with the mid-range level at $0.297. The trading volume has been low over the past three weeks, compared to the November rally that brought HBAR beyond the $0.25-level.
The daily RSI remained above neutral 50 despite the range formation – A sign that bullish momentum has the upper hand. And yet, this momentum is likely to be short-lived. Until traders witness a breakout backed by high volume, it would be better to treat the range as such and take swing trading positions accordingly.


Source: HBAR/USDT on TradingView
The 4-hour chart illustrated the challenges ahead more clearly. Under the $0.344 range high resistance, the $0.32-$0.324 area offered resistance. It was the area where HBAR bulls faced rejection and the price was forced to retest the range lows before rebounding in recent days.
Despite the nearly 20% hike from its lows, the CMF did not show sizeable capital inflows. In fact, the MACD has hovered around the neutral zero-mark in recent weeks, but it formed a bullish crossover to indicate upward momentum. Additionally, the DMI suggested a strong uptrend was beginning on the 4-hour chart.


Source: Coinglass
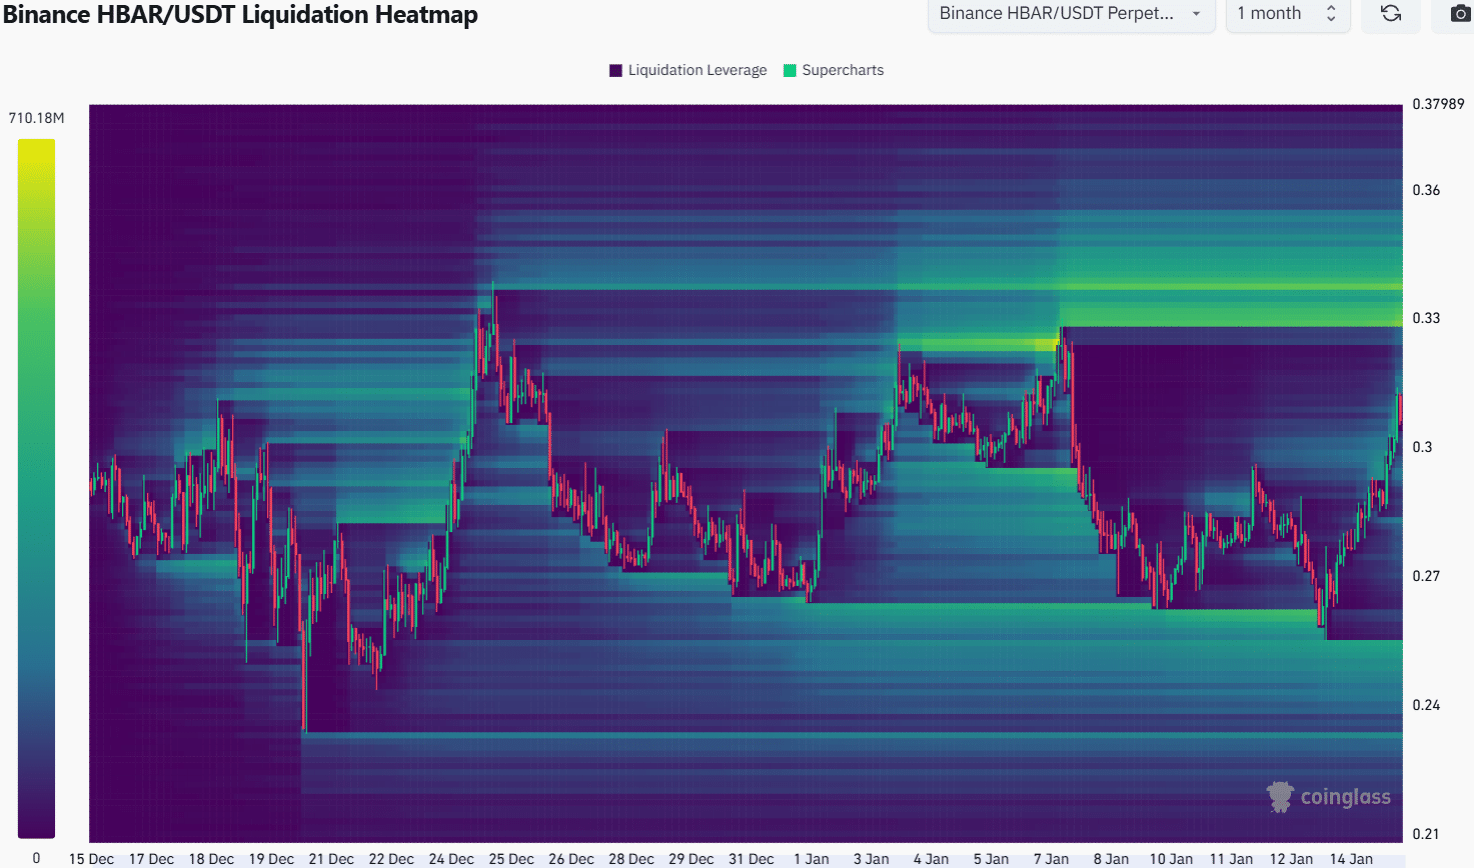
The liquidation heatmap highlighted the potential for a short-term bearish reversal from $0.337. The build-up of liquidity around the $0.26 zone over the past two weeks was swept on Monday before a quick bullish reversal.
Is your portfolio green? Check the Hedera Profit Calculator
The liquidity cluster at $0.33-$0.337 is the next magnetic zone and the near-term price target for Hedera. A move to this region would likely be followed by some consolidation and a retracement due to the lack of buying pressure to force the price higher.
Disclaimer: The information presented does not constitute financial, investment, trading, or other types of advice and is solely the writer’s opinion

